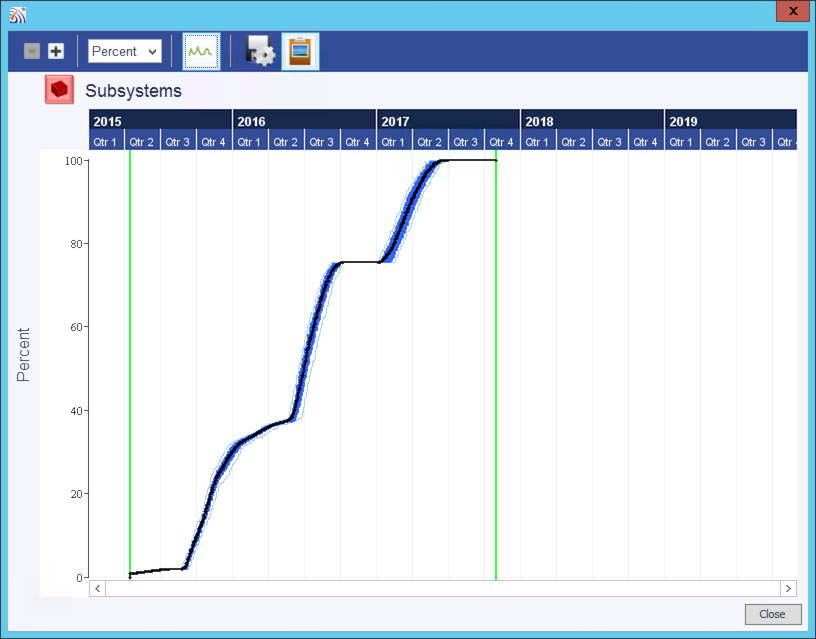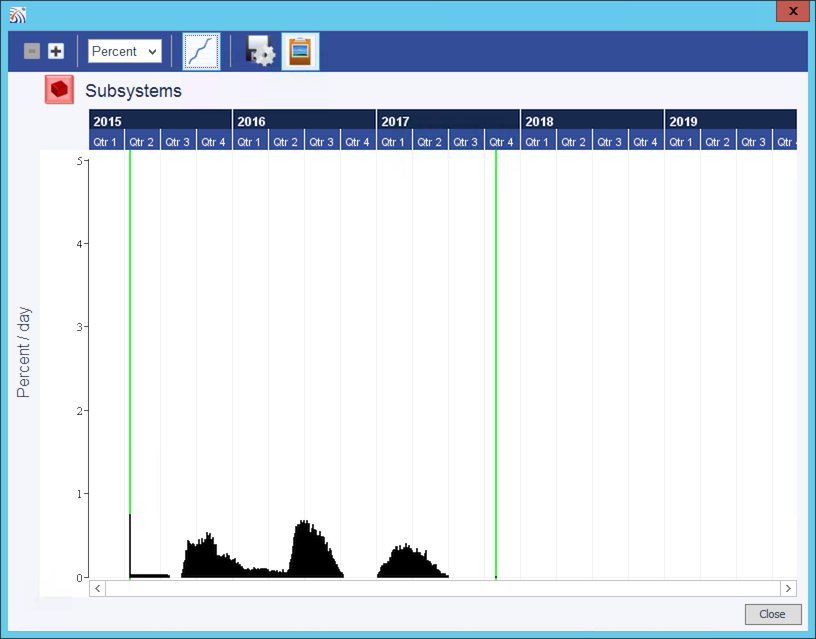
Timelines can be launched from the detail panes for
The timeline displays activity with variance. The content can be viewed as cumulative or by activity per day.
Variance is displayed as the vertical blue area above and below the black line. The blue filled area is the first standard deviation of variance, the blue lines outside this area are the min and max variance.
The green vertical lines indicate the project start and finish dates.


The standard timeline window supports controls to tailor the view to your needs.
| Control | Name and Type | Description |
|
|
Calendar scale control | Sets the calendar scale from days to quarters per column. Scale ranges from days, weeks, named months, numbered months, numbered quarters. Named months displayed above. |
|
|
Units selector | Select from available units to set the y-axis scale and the units exported. |
|
|
Cumulative/Daily | Toggle this button to see the timeline either as daily progress or cumulative progress (see above for images of both). |
|
|
Export | When selected, a file save dialog from your system will display. The data behind the chart is exported to a file location of your choosing. |
|
|
Copy to clipboard | When selected, an image of the Gantt chart will be copied to the clipboard for use in other documents. The image will retain the filters in use when the copy is created. |
The window can be closed with the Close button at the bottom right or with the operating system's X at the top right.
The window corners can be dragged to resize the window as desired. The vertical scale of the chart will adjust with the window size. The horizontal scale is determined by the calendar scale: enlarging the window allows you to see more of the calendar if it is scaled such that the duration of the timeline is too long for the view.